Education
An In-depth Look at the Gathered-Data Used to Drive the Districts' Strategic Plan for English
by Stuart Jenner
Last fall, I had a memorable conversation with a 10th grade student taking Middle Year International Baccalaureate English at Mt. Rainier High School. I asked her what book she was reading. She named the title and said, “it is a pretty simple book, and we’ve spent the entire first month on it.” I looked up the book and learned it was intended for a 7th grade audience. I thought to myself, “why would students who are supposed to be preparing for college-level classes the following year be assigned a middle school level book?”
The answer, it sadly turns out: many students are simply not reading at a high school level when they are in high school. A significant number are not reading at a middle school level either.
A mind boggling 35% of 9th grade students in spring 2025 tested at the elementary reading level, and another 35% tested at grades 6 through 8.
(The data in this story comes from iReady, which as explained on the Highline district web site, is an online service with both testing and instructional technology. Highline students in grades kindergarten through ninth currently take the tests in fall, winter and spring on English and math. This article is only about English. We will look at math in a future story.)
What is iReady data and how can you understand it?
In recent years, the Highline School District has revamped its reading program, held school board work study sessions on literacy, and made the percent of students making a "year’s growth" in reading, one of just two academic metrics, out of 18 total, in the strategic plan dashboard! So, grade-level proficiency is a priority, but not the focus. The most recent presentation on Oct 1, 2025 at their work study presentation, has five slides, (16 through 20), that show iReady scores in a stacked bar format. Though there are no numbers mysteriously, the bars do show that a significant number of students are three or more years below grade level.
(Other examples: October 16, 2024 on Literacy and Language has some slides about "growth" and scores by race, but no breakout by grade or mention of how far behind many students are. The April 16, 2025, presentation repeats slides 7 and 8 on "growth" and on outcomes by race. I looked at other work study session materials, for example the secondary redesign in May, but saw no mention of academic proficiency.)
Washington state uses the Smarter Balance Assessment, aka SBA, for assessing school performance. Previous Highline Journal and Burien.News articles have looked at SBA results: Scores Are Down, But Spending Is Up article, as well as these Summaries of Educational Stories on Burien.News.
There are two ways to look at the iReady outcomes:
- Grade Level Standards: Are students at grade level, above, or below? If below or above, how far?
- Growth: Are we meeting the district goals as stated: “Increase the percentage of students in grades K-8 who show at least one year of growth on i-Ready English Language Arts by 5% annually."-(Strategic Dashboard) They show the percentage of students who make a years or more of growth in English (ELA) and Math.
Are the iReady scores meaningful at measuring academic progress?
Since Highline is using the results, we have to take them seriously. These scores are the only academic metrics in the Highline strategic plan. But as the district web site states, “The purpose of this is not to give your child a score or grade, but instead to determine how best to support your child’s learning.”
So! How did Highline students do in the 2024-25 school year at meeting English standards and at making a "year’s worth of growth" in a year? In a word, poorly.
Some Findings: As kids progress in school years, they do not progress in academic achievement.
-For first graders, 59% are reading at or above grade level by year end.
-For second and third grades, only 28% and 27% are reading at or above grade.
-But by fourth through ninth grades, at most, only 20% of students are reading at or above grade level.
A major challenge is not just that students are below, but by HOW FAR they are below.
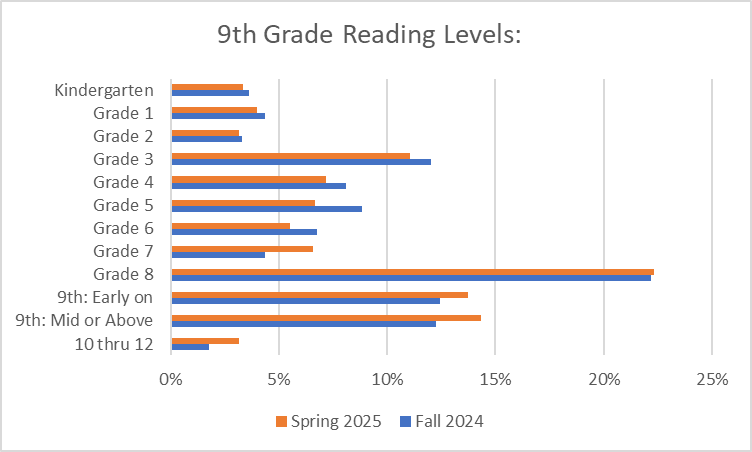
At every grade level, including ninth, there are a number of students who are reading at a kindergarten level. (In a future story, we will try to break down the data to understand students who are English Language Learners and where they contribute on this spectrum.)
In the spring 2025 test, 3% of ninth grade, 6% of eighth grade, 7% of seventh, 12% of sixth, and 9% of fifth are testing at the kindergarten level.
The bar charts on pages 16 to 20 in the Oct 1 work study materials are so aggregated that readers miss this tragedy:
There are some grades where we see improved numbers from the fall to the spring. But these tend to be in the younger grades.
I remember roughly 10 years ago when Highline was considering moving sixth grade from elementary to middle school. A selling point was “we can have specialists and differentiate instruction.” Well, is that happening? For sixth grade, going from 17% to 19% fall/spring in at or above grade level is not much to brag about.
Growth is a different metric than grade level. Students who are reading at a fourth grade level when they are in ninth grade may advance to fifth grade reading levels by the spring iReady test, so they’ve “made a full year of growth.” But is it really worth celebrating when they are going to start 10th grade reading at a fifth grade level? We will cover Growth more in Part 2 tomorrow.
So! You want more details about scores broken down by grade? Say no more!
(One caution: when comparing fall and spring results, keep in mind there are often more than 100 additional test takers in the spring than in the fall. This equates to around 8% more test takers. The reasons for this increase are unknown, but enrollment does not significantly increase during the school year.)
These summary tables shows the percentage of reading: at or above grade level, one year below, two years below, and three or more years below.
Ninth Grade
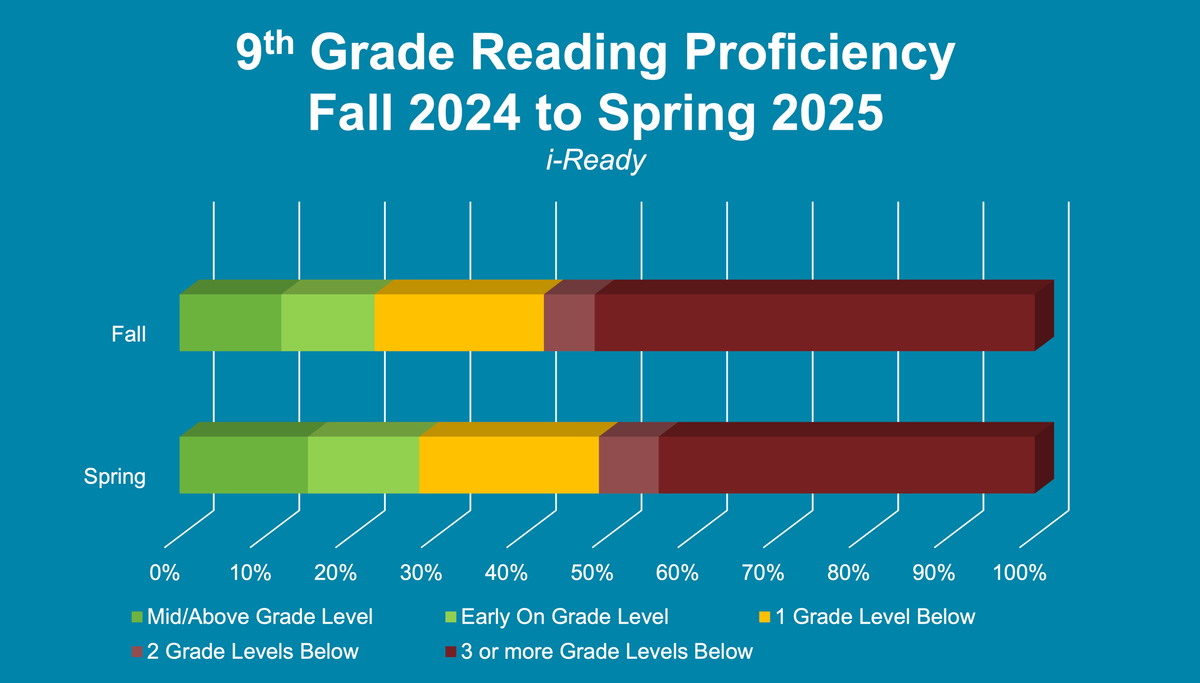
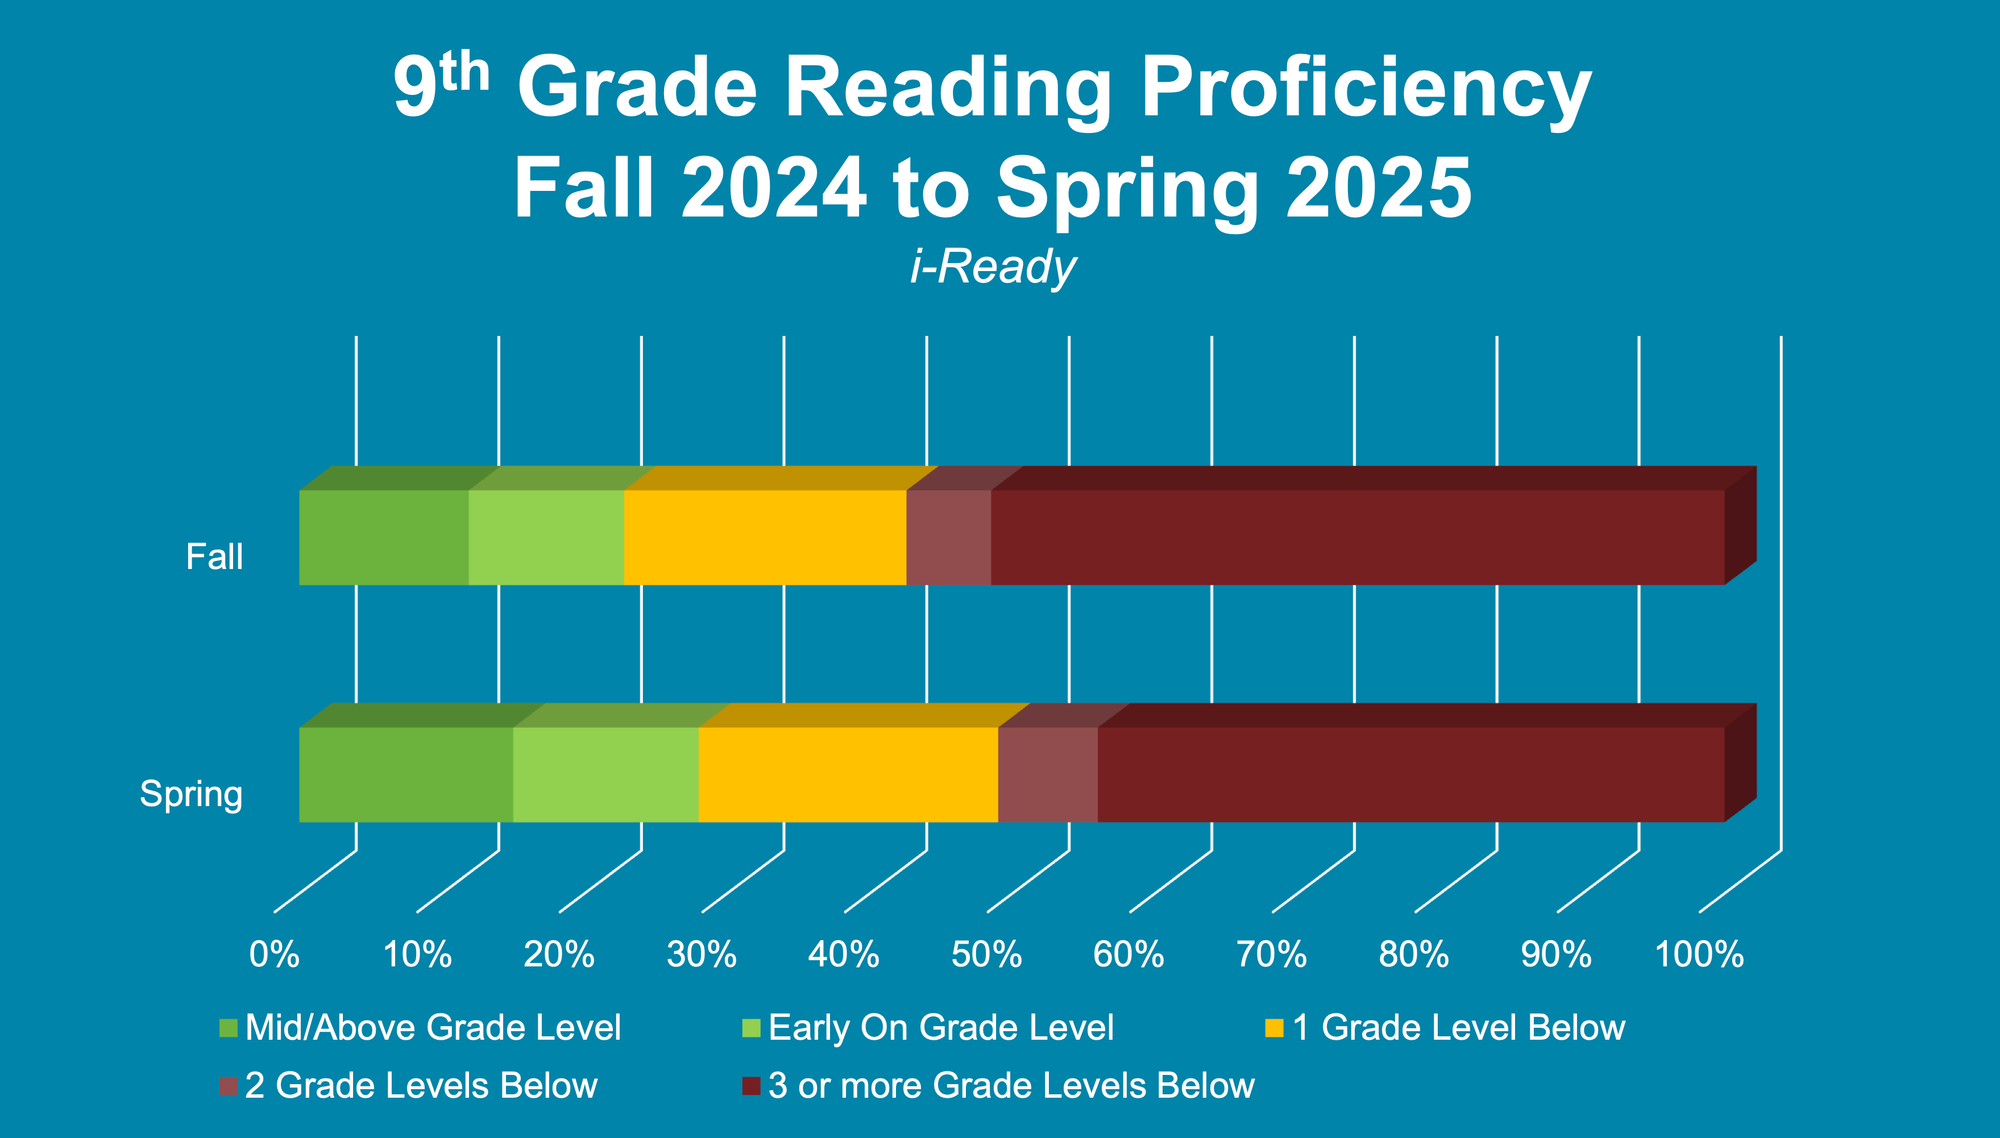
The total percentage testing at 8th or below was 73% in fall, and 70% in the spring. Here are details:
- At year end, 17% were mid or above grade level. This is an increase from 14% at the start of the year.
- In the Fall 2024 testing, 40% of ninth grade students tested at the Kindergarten through fifth grade level. The spring 2025 test had 35% test at K-5.
- The percent testing at 6th and 7th went from 11% to 13%.
- 22% each time tested at the 8th grade level.
Source: iReady data for Highline School District, 2024-25 school year, obtained from public records request.
Eighth Grade
At year end, 17% were reading at or above grade level. At year end, 49% are reading at the K-5 level, a slight move in the right direction from 51% at the start. Over 150 more students took the test in the spring compared to the fall.
Seventh Grade
14% rising to 17% are reading at or above grade level. For 7th grade, students reading three or more years behind are defined as reading at K-4. In the fall, 50% are in this group, with a slight improvement to 47% at year end.
Sixth Grade
For sixth, the first year of middle school, 46% of students in the fall test at a K, 1, 2 or 3 reading level. This is three or more years behind. In the spring, the percent is slightly less bad, at 44%. The percent reading at grade level at year end, 14%, is lower than the number reading at third and fifth grade levels, and almost the same at 14% as the number reading at a kindergarten level at year end, 12%.
Fifth Grade
This grade has some improvement. 11% reading at 5th mid or above improved to 19% at year end.The percent reading at K-2, which means three or more years behind went from 31 to 25%.
Fourth Grade
The percent reading at 4th mid and above nearly doubled, from 11 to 20%. But still, 69% are a year or more behind at year end.There was some improvement in the percent reading at K and 1.
Third Grade
Third grade is often cited as a pivotal year for students learning to read. The percent of students mid or above increase from 16% to 27%. The percent at K, 1 and 2 dropped from 62% to 51%.
Second Grade
28% are mid or above at the end of the year, up from 14% in the fall,. The percent at K and 1 reading levels dropped from 72% to 56%.
First Grade
This grade has a definition of “emerging K” that is only used in K and 1.
This is the only grade where more than half the students are mid or above.
Kindergarten
I am not reporting this data. The number of kindergarten students who took the test in fall 2024, at 397, was much lower than the 1177 who took the test in the spring, making it hard to draw comparisons. I personally am skeptical of whether any online test for kindergarten students measures reading ability, or measures computer skills.
For Part 2: 'Looking at "Growth": Highline's iReady Data Spells Big Challenges for Literacy
Members Discussion
Highline Journal Comment Guidelines
We believe thoughtful conversation helps communities flourish. We welcome respectful, on-topic comments that engage ideas, not individuals. Personal attacks, harassment, hateful comments, directed profanity, false claims, spam, or sharing private information aren't allowed. Comments aren't edited and may be removed if they violate these guidelines.