Education

Overview
Last year, on Sept. 11th, Burien.News published a story about very low test scores and lack of recovery on the Smarter Balanced Assessment (SBA). This is the main test the state uses to monitor student results. The SBA assesses math and reading (ELA) skills for 3rd through 8th and 10th grades. Additionally, it is given for science in the 5th and 8th grades.
The frustrating news: this year is essentially a repeat of last year.
- There is NO significant recovery to pre-COVID scores
- There is NO closing the gap of Highline to the rest of the state
“This year is essentially a repeat of last year — no recovery, and no narrowing of the gap.”
Specific Results
- Just 33 percent of ELA test-takers are in the proficient category. This is a bit below the 33.2 percent in 2024.
- 23.9 percent of math test-takers are proficient, a tiny gain from 22.1 percent in 2024.
The Bad News Continues
- The gap between Highline ELA and state ELA is the worst in at least the past seven years.
- The math gap is slightly narrower than the gap of last year, but still the second-worst of the past seven test cycles.
“Highline’s ELA gap is the worst in at least seven years.”
Use Caution When Looking at State Data
As of Sept. 10, 2025, State Superintendent Chris Reykdal of the Office of the Superintendent of Public Education (OSPI) announced changes on how academic outcome percentages on the state schools report card would be presented.
Be sure to understand the definitions that the state as a whole is reporting, especially the difference between the new and old baselines for academic data.
Here’s a simple breakdown:
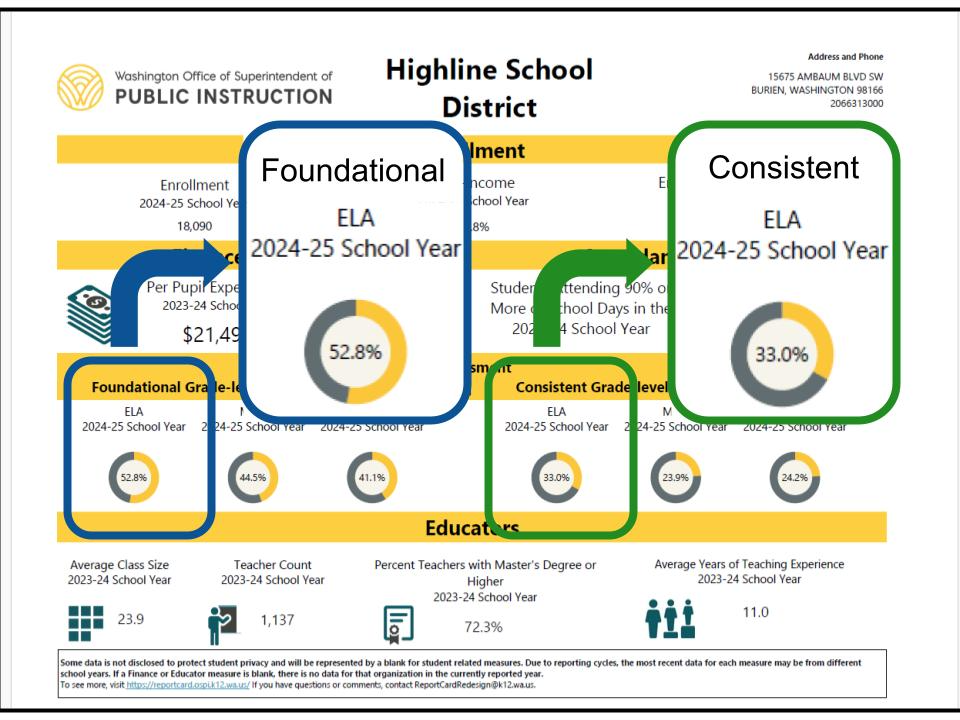
- Foundational grade-level knowledge (Level 2): Student shows some of the grade-level skills but is not yet fully proficient.
- Consistent grade-level knowledge (Levels 3 & 4): Student meets or exceeds proficiency and shows skills reliably at grade level.
💡
In other words: Foundational = almost there. Consistent = truly proficient.
These numbers, as presented in last year’s story, are for the percentage of students getting a 3 or 4 on the SBA. This is defined as “proficient,” or "consistent."
Confusingly, when looking at the data on the OSPI website, the default page for Highline shows much higher numbers. The reason: OSPI is now showing percentages of students with “foundational” scores. These scores include a 2 as well as a 3 or 4. The rationale is that some students who get a 2 do go on to college, though, based on the state’s definition, they likely need remediation.
💡
Important Note on “Proficiency”
OSPI has changed how it defines “proficient.” Instead of counting only Levels 3 and 4 (true grade-level skills), the state now includes Level 2 (“foundational”) in the proficiency category.
This shift makes it appear that proficiency jumped by nearly 20% statewide.
For example, in Highline the new baseline shows 52.8% of students “proficient” in ELA — but under the traditional standard, the real figure is only 33%.
Do Higher Categories Change the Story?
Does Highline show improvement if we add together the students scoring a 2 with the students scoring a 3 or 4? No.
The easy way to look at this is to show the percent of students getting a 1, the only other option besides 2, 3, and 4. Again, the answer is very frustrating:
- There were more students who got a 1 on ELA – 41.3% in 2025 – than the 40.0% of 2024 and the 39.0% in 2023.
- For math, Highline has had three years in a row that are essentially flat for students getting a 1: two years of 49.0%, a little worse than 48.8% in 2023.
“In 2025, more Highline students scored at the very bottom (Level 1) in ELA than in the two years prior.”
Summary: ELA Results (2018–2025)
| Year | Highline (%) | State (%) | Gap (Highline – State) |
|---|---|---|---|
| 2018 | 48.8 | 59.4 | -10.6 |
| 2019 | 47.5 | 59.6 | -12.1 |
| 2021 | 31.9 | 47.7 | -15.8 |
| 2022 | 33.4 | 50.7 | -17.3 |
| 2023 | 34.0 | 50.7 | -16.7 |
| 2024 | 33.2 | 50.3 | -17.1 |
| 2025 | 33.0 | 52.9 | -17.9 |
Change from 2018 to 2025:
- Highline: -15.8%
- State: -6.5%
Summary: Math Results (2018–2025)
| Year | Highline (%) | State (%) | Gap (Highline – State) |
|---|---|---|---|
| 2018 | 38.6 | 49.5 | -10.9 |
| 2019 | 34.6 | 48.9 | -14.3 |
| 2021 | 16.5 | 30.4 | -13.9 |
| 2022 | 21.5 | 37.7 | -16.2 |
| 2023 | 22.5 | 39.1 | -16.6 |
| 2024 | 22.1 | 39.7 | -17.6 |
| 2025 | 23.9 | 40.7 | -16.8 |
Change from 2018 to 2025:
- Highline: -14.7%
- State: -8.8%
What’s Next
Future stories will also drill into individual schools and look at grade-level changes.
If you want to explore the SBA data, it is available here:
Members Discussion
Highline Journal Comment Guidelines
We believe thoughtful conversation helps communities flourish. We welcome respectful, on-topic comments that engage ideas, not individuals. Personal attacks, harassment, hateful comments, directed profanity, false claims, spam, or sharing private information aren't allowed. Comments aren't edited and may be removed if they violate these guidelines.